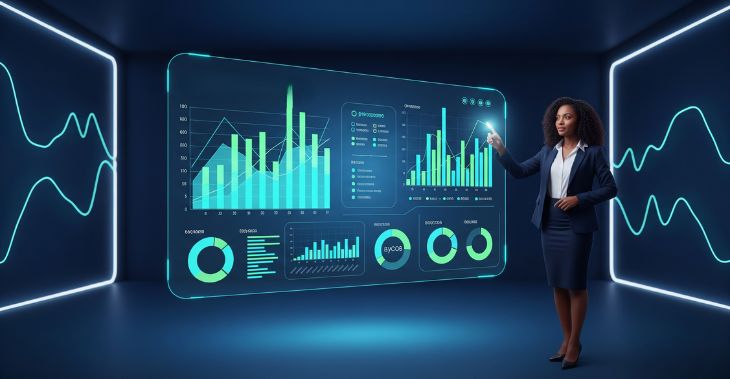
Data is most powerful when it’s easy to understand. Our data visualization services turn complex datasets into interactive charts, dashboards, and reports that highlight patterns, trends, and opportunities. With clear visuals, decision-makers can grasp insights quickly and take action with confidence.

Custom dashboard development – tailored views for executives, teams, or departments.
Interactive charts & reports – explore data dynamically for deeper insights.
Real-time visualization – monitor performance with live data feeds.
Integration with BI tools – Power BI, Tableau, Google Data Studio, and more.
Storytelling with data – communicate insights in a clear, compelling way.
Mobile-friendly dashboards – access insights anywhere, anytime.
It simplifies complex information, making it easier to understand and act on.
We work with leading platforms like Tableau, Power BI, and Google Data Studio.
Yes, we design dashboards that update with live data feeds.
Absolutely. We build them to fit your business needs and KPIs.
Yes. We ensure your team can use and interpret the tools effectively.
support@binticyber.com
Mombasa, Kenya.
© BintiCyber 2025. All Rights Reserved
WhatsApp us

